Classifying News Sentiments using python
Sentiment Analysis on Stock Market Data
Using python code to prioritize news articles to read based on how good or bad the news is with respect to various companies or assets in a portfolio.
I will show you how I am able to analyze news headlines across many asset in my stock portfolio using web scrapping techniques and natural language processing (NLP) .
What is a Stock Portfolio?
Stock portfolio is a collection of stocks that you invest in with the hope of making a profit. By putting together a diverse portfolio that spans various sectors you’re able to become a more resilient investor. That’s because if one sector takes a hit, the investments you hold in other sectors aren’t necessarily affected.
What is Web Scraping?
Web scraping refers to the extraction of data from a website. This information is collected and then exported into a format that is more useful for the user. Be it a spreadsheet or an API.
What is Natural Language Processing?
Natural language processing (NLP) is a branch of artificial intelligence that helps computers understand, interpret and manipulate human language. NLP draws from many disciplines, including computer science and computational linguistics, in its pursuit to fill the gap between human communication and computer understanding.
# Import required libraries

from urllib.request import urlopen, Request
from bs4 import BeautifulSoup
from nltk.sentiment.vader
import SentimentIntensityAnalyzer
import pandas as pd
import matplotlib.pyplot as plt
Next, we want to extract news articles for the different assets in our portfolio from a news source, here we use www.finviz.com. Then we store it in a python dictionary.
# Collect the news from finviv.com into tables  news_tables = {}
period = 20
finviz_url = 'https://finviz.com/quote.ashx?t='  tickers = ['AAL','AHT','AQMS','NIO']
for ticker in tickers:
     url = finviz_url + ticker
     req = Request(url=url, headers={'user-agent':'my-app'})          response = urlopen(req)
     html = BeautifulSoup(response,'html.parser')           news_table = html.find(id='news-table')
     news_tables[ticker]= news_table
Extract features we want from the webpage we copied from finviz
# Extract the important variables from the data collected.parsed_data = []  for ticker, news_table in news_tables.items():
     for row in news_table.findAll('tr'):
          title = row.a.get_text()
          date_data = row.td.text.split(' ')                    if len(date_data) == 1:
               time = date_data[0]
          else:
               date = date_data[0]
               time = date_data[1]

         parsed_data.append([ticker, date, time, title])# save as pandas dataframedf = pd.DataFrame(parsed_data, columns=['ticker', 'date', 'time', 'title'])
Here we apply Natural Language Processing with the help of the Sentiment Intensity Analyzer from the NLP toolkit. A positive value means it is a good news and the value shows how strong the good news is and vice versa
VADER (Valence Aware Dictionary and Sentiment Reasoner) is a lexicon and rule-based sentiment analysis tool that is specifically attuned to sentiments expressed in social media.
VADERuses a combination of A sentiment lexicon is a list of lexical features (e.g., words) which are generally labeled according to their semantic orientation as either positive or negative.VADERnot only tells about the Positivity and Negativity score but also tells us about how positive or negative a sentiment is.
# carry out the sentiment analysis on the  data

vader = SentimentIntensityAnalyzer()

# Using a lambda function to treat each row of the compound function
condition = lambda title: vader.polarity_scores(title)['compound'] # Applying the condition on the compound feature
df['compound'] = df['title'].apply(condition)  # Convert the data column to pandas datetime
df['date'] = pd.to_datetime(df['date']).dt.date
mean_df = df.groupby(['ticker','date']).mean().unstack().xs('compound', axis='columns').transpose()
mean_df = mean_df.iloc[-period:]
Finally, let’s make a plot to visualize the sentiments for our companies over a defined period.
# Plot a bar chart to visualize our sentiments.

plt.figure(figsize=(15,8))

plt.bar(mean_df.index,mean_df.NIO , label='NIO')
plt.bar(mean_df.index,mean_df.AQMS, label='AQMS')
plt.bar(mean_df.index,mean_df.AAL, label='AAL')
plt.bar(mean_df.index,mean_df.AHT, label='AHT')
plt.title('Sentiment Intensity Chart')
plt.xlabel('News days over the past 20 days period')
plt.ylabel('Sentiment Intensity')
plt.legend()

plt.show()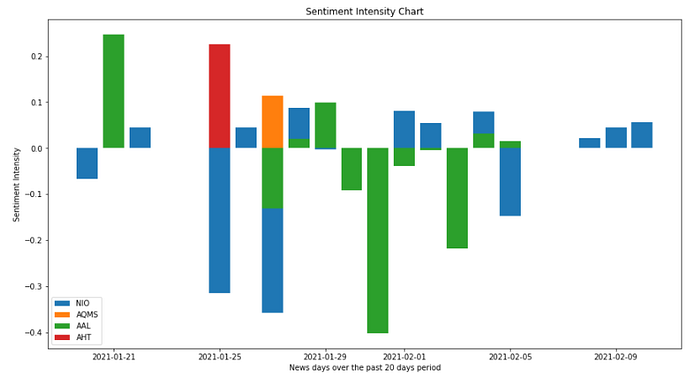
With the help of a few lines of code, we have been able to visualize sentiments extracted from news headlines.
This helps us make informed decisions about buying or selling an asset from our portfolio.
It also saves us time from having to read through every news headline
Sentiment analysis (or opinion mining) is a natural language processing technique used to determine whether data is positive, negative or neutral. Its application ranges from various domains, Sentiment analysis is often performed on textual data to help businesses monitor brand and product sentiment in customer feedback, and understand customer needs.
Here is a link to the complete project on my github.
